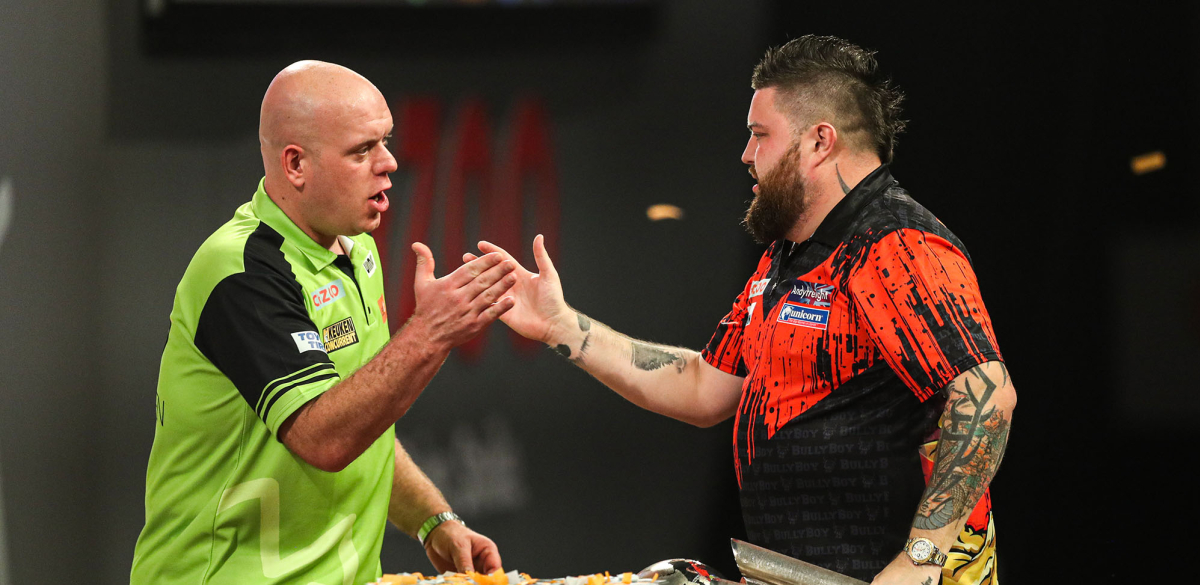
PDC stats analyst Christopher Kempf assesses how three-dart averages can be misleading when it comes to analysing results, as he outlines a new statistical benchmark for elite darts performance.
Darts is unique for its obsession with the three-dart average.
The result of every match is accompanied by this number, and in the eyes of fans it is viewed as a better snapshot metric of a player's performance than the actual score of the match.
Similar metrics do exist in other sports, but are certainly not accorded the same importance as the three-dart average.
Most other sports are neither composed of such discrete, repeated actions as is darts with its hundreds of throws at the board, nor are the success or failure of those actions so easily quantifiable as the darts' positions in or out of the desired segment.
Darts fans get two interesting pieces of information from every match: the final score in legs (denoting timing, finesse and 'winning instinct') and an abstract three-dart average (denoting potential, ability and how the match might have turned out if just a few more legs were played).
However, in practice, averages have more potential to mislead in this role than to inform - the best way to increase averages, especially at the highest levels of the game, is to lose legs (i.e. face opponents who consistently get to a finish first).
In the most high-profile tournaments, averages are a not an ideal predictor of the outcomes of matches. In the history of the Premier League, 219 of the 1,126 matches that did not end in a draw were won by the player with the lower average (19.4%).
Premier League debutant Chris Dobey has averaged 100+ in 40% of his matches in the 2023 Premier League, but those high averages resulted in only two of his seven wins in the tournament.
We can evaluate the relationship between averages and wins mathematically by using correlation coefficients, where 1 would (theoretically) indicate that high averages always result in wins, and -1 that higher averages always result in losses.
In the 2023 Premier League, the correlation coefficient between averages and matches won is 0.284, and between average difference (between the player and his opponent) and matches won is 0.508.
Such a positive relationship does not always exist between "good" stats and match wins; for example, a higher percentage of successful double setups from 141-180 actually has had slightly negative correlation with winning matches in the 2023 Premier League.
Nevertheless, the average is not the best-performing statistic that could easily be calculated: that honour goes to the percentage of legs won in 15 darts or fewer.
The raw statistic correlates with match-winning at 0.549, with the difference between the player's and opponent's five-visit leg percentages coming in at 0.578.
More than two-thirds of legs in the Premier League are won in 15 darts or fewer. The percentage has slowly increased over the years, but there has never been a year in the history of the tournament in which 50% of legs won were completed in 16 darts thrown or more.
In 24% of legs in the 2023 Premier League, one player did not get a chance to win in 15 darts or less, but these are precisely the legs, consisting mostly of high-scoring trebles, which distort the losing players' averages.
There is no way to raise one's 15-darter percentage while losing legs, as with averages: either a player wins by the end of the fifth visit, does not win, or doesn't get the chance - in which case it doesn't count against them, regardless of how many or how few points were scored.
Moreover, the player with the higher average is three times more likely than the player with the higher 15-darter % to have lost the match.
Consider last week's match between Michael van Gerwen and Michael Smith, which Smith won 6-4. Van Gerwen's average of 99.40 was nearly 8 points higher than that of Smith; from that fact alone one could assume, with 95% certainty, that Van Gerwen won.
However, the 15-dart-leg-winning statistics for the two players lead us in a more enlightening direction: Smith won 4 of 9 (44%) legs in 15 darts or fewer, while Van Gerwen won only 3 of 9 (33%).
The difference between those two percentages, in Smith's favour, would lead us correctly to believe that Smith had won, and not Van Gerwen, who wasted many of his highest per-visit scores on legs that he eventually lost.
Finally, averages in a long match - such as the World Championship final - are unlikely to give us clear information about whose performance was truly superior.
The 2023 final exhibited an averages difference of 1.3 points in favour of Smith, close enough to be barely indicative of who was likely to have been the winner in that 46-leg match.
Yet, the 15-dart percentages truly tell the tale of Smith's dismantling of Van Gerwen - Bully Boy converted 60% of his 35 attempts at 15-dart legs, while Van Gerwen only managed to 'arrive in five' in 44% of his.
If the numbers we associate with the 2023 World Championship final were not 100.87 vs 99.58 but rather 60 vs 44, we would surely have a better indication of which player truly 'deserved to win'.
Follow Christopher Kempf on Twitter through @Ochepedia.