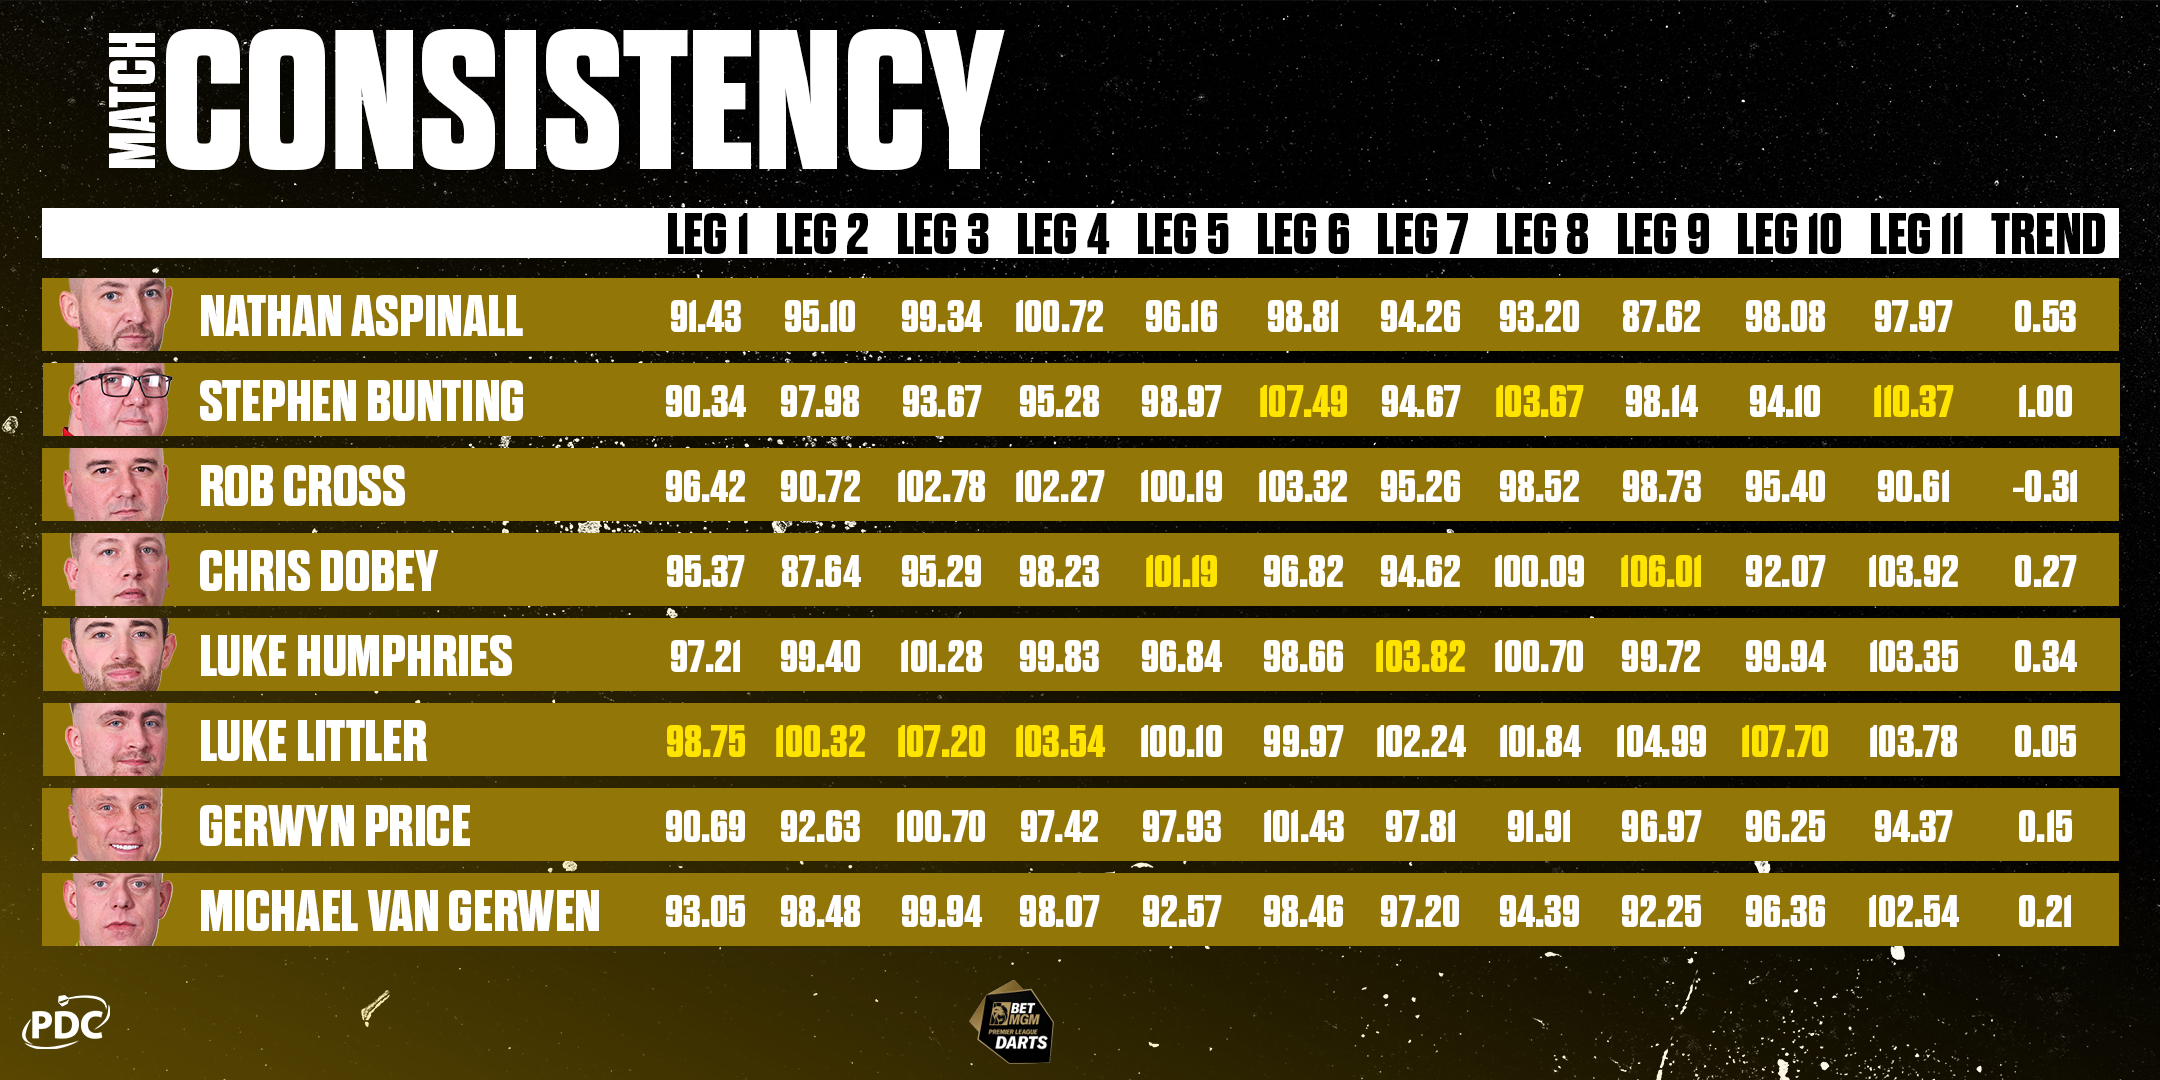
In his latest column, PDC Stats Analyst Christopher Kempf analyses the leg-by-leg consistency of this year's BetMGM Premier League stars, ahead of the final night of league phase action in Sheffield.

It's no surprise that the first leg of a match presents the biggest challenge to the Premier League contestants: anywhere from hours to weeks of time could separate those first legs from the final leg of the last match they contested.
With only a few warm-up darts available to acclimatise the players to the stage lights and boisterous crowd, no player has managed a 100 average, and the League writ large only manages a 94.4 average in the opening leg of their matches.
That nervous tension even spills over into the second leg, which improves on the first's average only by a point.
Though Chris Dobey has a higher overall average in the Premier League than Gerwyn Price, Nathan Aspinall or Michael van Gerwen, his unsuccessful efforts at the beginning of matches (winning 30% of his first legs, averaging 88 in his second) proved fatal in his Play-Off quest.
Stephen Bunting has won four of his five deciding legs in the 2025 Premier League, and demolished opponents with a 110.37 average in those deciders, but has won three of the 16 matches which did not extend to the 11th leg.
All players are guaranteed to contest at least six legs in a Premier League match, and Bunting on average has been trailing 2-4 after those legs, needing breaks of throw just to extend the match - but Bunting has also lost a majority of his 7th-10th legs.
Only one player's average trends downwards as the match progresses. Rob Cross puts forth an impressive 99.28 average in legs 1-6, but does not equal that average in any subsequent leg, to the point of losing five of his seven deciding legs with a combined 90.61 average.
Unlike Bunting, whose best legs come too late to save the match, Cross frequently takes the lead going into the seventh leg, but squanders it as his averages decline under pressure.
Luke Humphries' averages have been the most consistent throughout the match: there is less than a seven-point difference in averages between his worst leg (5th) and his best (7th): only in the middle of the match (5th and 6th legs) does he lose more legs than he wins.
While Luke Littler's averages fluctuate more, the line described by the averages of his 11 legs is nearly flat, indicating a trend of only 0.05 points' increase from leg to leg.
Littler has averaged 106 in his 9th and 10th legs, and with only 11 matches proceeding to a deciding leg, Littler has an outstanding record of closing out 69% of those matches with a 6-3 or 6-4 final scoreline.
Gerwyn Price's perfect legs may have come in the 7th and 9th legs of the two matches in which he completed them, but the end-game has not been his strength.
Price breaks a 100 average in the 3rd and 6th legs and leads the way in 180s in his 6th legs, and having won 13 of 25 matches in the tournament thus far, he has been able to win just enough legs after that to attain that winning record.
His brace of nine-darters - while earning him much money and recognition - were of no relevance to his semi-final qualification as he lost both matches in which they were thrown.
The eight Premier League players in combination have contested 24 deciding legs this year, and they have brought forth their best efforts in doing so, averaging 100.84.
Michael van Gerwen and Nathan Aspinall have thrown more 180s in their deciders (per leg played) than in any other leg, and for Van Gerwen it is the only leg out of 11 in which the seven-time Premier League champion has averaged more than 100.
However, waiting until a decider is not a winning strategy; while Aspinall's efforts overall have been inferior to MvG's in 11th legs, he has not needed to contest them to put the latter on the brink of elimination.
Follow Christopher on Twitter @ochepedia